PROTESTING PROPERTY TAXES
IN DALLAS COUNTY.
Protesting your home’s property value could help reduce your property taxes. In 2025, North Texas Property Tax clients in Dallas County received an average reduction of $124,099 on their property value.
PROTESTING PROPERTY TAXES IN DALLAS COUNTY.
Protesting your home’s property value could help reduce your property taxes. In 2025, North Texas Property Tax clients in Dallas County received an average reduction of $112,432 on their property value.
For Residential Homestead Reductions
2025 Dallas Protest Results
North Texas Property Tax
Other Agents
Ownwell Inc.
Explore What You Can Save
Estimating Property Taxes in Dallas County
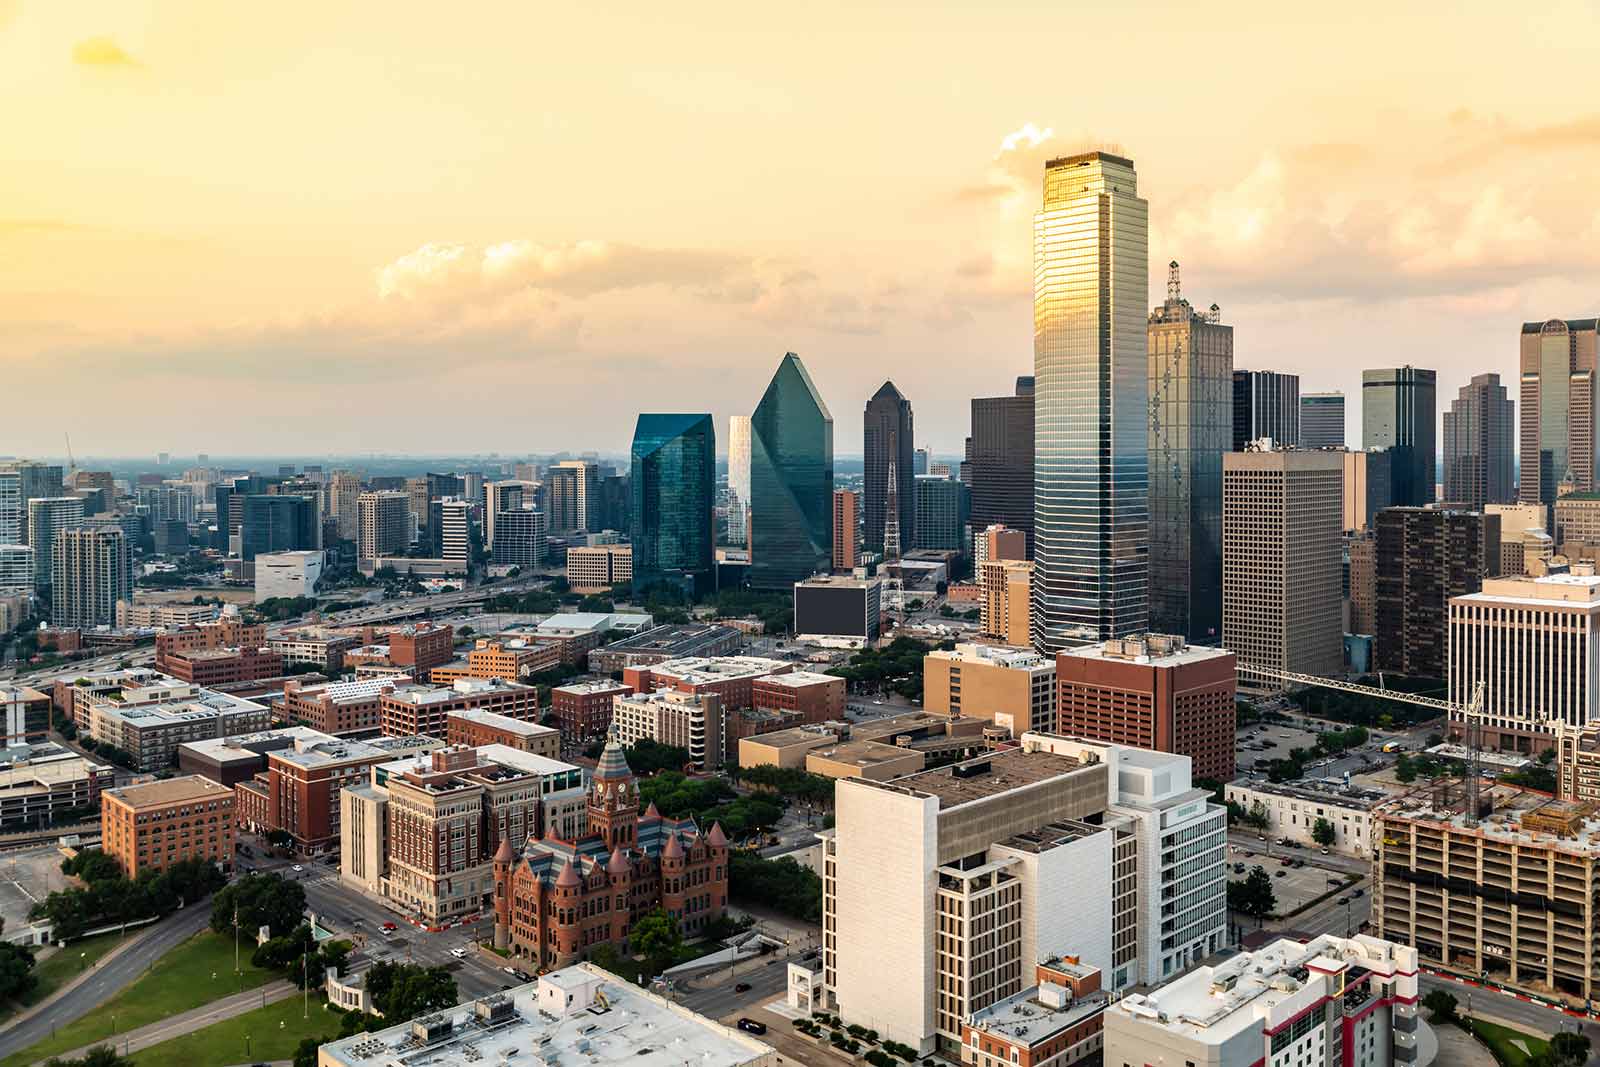
The Dallas County Appraisal District sets the value of residential and commercial property in Dallas County for the purpose of determining property taxes. Sometimes the values that the district assigns are more than they should be, and protesting these valuations can lower the amount of property taxes you pay.
Protesting property taxes in Dallas County is your right as a property owner. Learn more about what you could pay in property taxes and steps you can take to reduce what you owe.
Read More
Property taxes are calculated based on assessed value each year. Rates vary based on the taxing entities associated with each property, including the city, school, and water district. Due to taxing entity boundaries, one property can be taxed differently than its neighbor.
For the reasons above, we use a 2.5% tax rate when estimating property taxes with clients. A Dallas County resident with a $1 million home in Highland Park, could pay $25,000 when accounting for taxes from Highland Park city, school district tax rates, and other Dallas County taxing entities. Note that this is just an estimate and does not account for tax exemptions, taxing entity boundaries, etc.
If you are a homeowner in Dallas County, learn more about tax rates and exemptions on the Dallas Central Appraisal District website.
Are your property taxes higher than you think they should be? Let our experienced tax consultants manage the protest process for you.
More Savings from Year to Year
Sample Reductions in Dallas County
*These are reductions obtained across Dallas County
| Street | Original Value | Final Value | Reduction | % Percentage |
|---|---|---|---|---|
| Amherst Avenue | $1,630,370 | $1,326,000 | $304,370 | 18.67 % |
| Axminster Court | $2,778,400 | $1,690,000 | $1,088,400 | 39.17 % |
| Belclaire Avenue | $9,686,760 | $7,600,000 | $2,086,760 | 21.54 % |
| Belfort Avenue | $4,829,610 | $3,635,000 | $1,194,610 | 24.74 % |
| Boca Raton Drive | $3,659,820 | $2,966,760 | $693,060 | 18.94 % |
| Boedeker Drive | $1,446,170 | $920,000 | $526,170 | 36.38 % |
| Brookshire Drive | $1,638,920 | $1,300,000 | $338,920 | 20.68 % |
| Clayton Avenue | $1,342,610 | $850,000 | $492,610 | 36.69 % |
| Cochran Chapel Circle | $652,370 | $526,410 | $125,960 | 19.31 % |
| Edgecove Drive | $773,680 | $630,490 | $143,190 | 18.51 % |
| Edmondson Avenue | $2,237,140 | $1,750,000 | $487,140 | 21.78 % |
| Farquhar Lane | $3,681,810 | $2,857,740 | $824,070 | 22.38 % |
| Glenheather Court | $1,517,510 | $1,239,000 | $278,510 | 18.35 % |
| Goodwin Avenue | $819,280 | $627,880 | $191,400 | 23.36 % |
| Grassmere Drive | $720,410 | $450,000 | $270,410 | 37.54 % |
| Green Park Drive | $4,475,600 | $3,100,000 | $1,375,600 | 30.74 % |
| Inverness Lane | $1,752,810 | $1,400,000 | $352,810 | 20.13 % |
| Lakewood Blvd | $1,908,220 | $1,544,000 | $364,220 | 19.09 % |
| Lovers Lane | $922,940 | $738,000 | $184,940 | 20.04 % |
| Lupton Drive | $1,754,020 | $925,000 | $829,020 | 47.26 % |
| Mariposa Drive | $779,800 | $601,000 | $178,800 | 22.93 % |
| Milton Street | $3,260,170 | $2,630,000 | $630,170 | 19.33 % |
| Mockingbird Lane | $1,477,330 | $1,150,000 | $327,330 | 22.16 % |
| Morningside Avenue | $848,240 | $615,000 | $233,240 | 27.50 % |
| Museum Tower Condo | $3,217,200 | $2,050,000 | $1,167,200 | 36.28 % |
| N Collins Road | $779,660 | $612,000 | $167,660 | 21.50 % |
| N Crawford Street | $1,549,390 | $1,230,000 | $319,390 | 20.61 % |
| Normandy Avenue | $7,420,430 | $5,899,000 | $1,521,430 | 20.50 % |
| Overdowns Drive | $1,439,400 | $1,100,000 | $339,400 | 23.58 % |
| Park Bridge Court | $4,286,060 | $3,446,920 | $839,140 | 19.58 % |
| Parwen Drive | $3,295,450 | $2,700,000 | $595,450 | 18.07 % |
| Peavy Road | $2,123,790 | $1,728,680 | $395,110 | 18.60 % |
| Pemberton Drive | $2,873,430 | $2,337,000 | $536,430 | 18.67 % |
| Preston Haven Drive | $2,737,980 | $2,200,000 | $537,980 | 19.65 % |
| Prestonshire Lane | $2,237,570 | $1,700,000 | $537,570 | 24.02 % |
| Promontory Drive | $2,203,860 | $930,000 | $1,273,860 | 57.80 % |
| Robledo Drive | $7,518,460 | $5,849,450 | $1,669,010 | 22.20 % |
| S Better Drive | $1,736,960 | $1,280,000 | $456,960 | 26.31 % |
| Southridge Drive | $1,351,180 | $1,087,000 | $264,180 | 19.55 % |
| Stefani Drive | $1,284,290 | $1,037,000 | $247,290 | 19.25 % |
| Swiss Avenue | $1,301,750 | $960,000 | $341,750 | 26.25 % |
| Turtle Creek Blvd | $11,156,880 | $8,500,000 | $2,656,880 | 23.81 % |
| Vendome Condo | $3,570,000 | $2,835,000 | $735,000 | 20.59 % |
| Vickery Blvd | $784,490 | $623,250 | $161,240 | 20.55 % |
| W Bethel Road | $3,112,480 | $2,200,000 | $912,480 | 29.32 % |
| W Wintergreen Road | $1,102,070 | $826,550 | $275,520 | 25.00 % |
| Wander Lane | $5,636,560 | $4,264,790 | $1,371,770 | 24.34 % |
| Watauga Road | $7,933,750 | $6,410,220 | $1,523,530 | 19.20 % |
| Westlake Avenue | $2,146,950 | $1,750,000 | $396,950 | 18.49 % |
| Winton Street | $2,288,310 | $1,731,000 | $557,310 | 24.35 % |
| Street | Original Value | Final Value | Reduction | % Percentage |
|---|---|---|---|---|
| Alpha Road | $982,960 | $771,000 | $211,960 | 21.56 % |
| Amherst Avenue | $2,079,880 | $1,650,000 | $429,880 | 20.67 % |
| Arbor Brook Lane | $1,192,540 | $848,000 | $344,540 | 28.89 % |
| Ash Bluff Lane | $5,682,760 | $4,779,860 | $902,900 | 15.89 % |
| Azure Condo | $4,826,950 | $3,021,430 | $1,805,520 | 37.40 % |
| Belclaire Avenue | $8,016,110 | $6,192,500 | $1,823,610 | 22.75 % |
| Blackburn Drive | $1,880,250 | $1,360,170 | $520,080 | 27.66 % |
| Blanch Circle | $2,892,070 | $2,175,390 | $716,680 | 24.78 % |
| Bleu Ciel Circle | $2,278,780 | $1,709,090 | $569,690 | 25.00 % |
| Boca Raton Drive | $2,183,650 | $1,689,220 | $494,430 | 22.64 % |
| Bowser Avenue | $857,110 | $625,000 | $232,110 | 27.08 % |
| Cherokee Trail | $10,975,440 | $8,134,620 | $2,840,820 | 25.88 % |
| Colgate Avenue | $5,386,470 | $4,558,000 | $828,470 | 15.38 % |
| Douglas Avenue | $2,690,300 | $2,100,000 | $590,300 | 21.94 % |
| Emerson Avenue | $1,255,710 | $975,000 | $280,710 | 22.35 % |
| Fondren Drive | $2,741,840 | $1,924,000 | $817,840 | 29.83 % |
| Forest Cove Circle | $1,460,120 | $1,165,000 | $295,120 | 20.21 % |
| Glendora Avenue | $3,668,730 | $2,774,050 | $894,680 | 24.39 % |
| Glenwood Avenue | $5,153,430 | $3,758,940 | $1,394,490 | 27.06 % |
| Hanover Avenue | $3,990,780 | $3,113,400 | $877,380 | 21.99 % |
| Lake Edge Drive | $1,951,760 | $1,550,000 | $401,760 | 20.58 % |
| Lavendale Avenue | $2,561,270 | $1,972,000 | $589,270 | 23.01 % |
| Livingston Avenue | $1,063,110 | $850,000 | $213,110 | 20.05 % |
| Lorraine Avenue | $2,473,320 | $1,907,000 | $566,320 | 22.90 % |
| Meadow Road | $2,112,920 | $1,675,000 | $437,920 | 20.73 % |
| Meadowcreek Road | $1,084,220 | $860,000 | $224,220 | 20.68 % |
| Morningside Avenue | $766,370 | $607,320 | $159,050 | 20.75 % |
| Museum Tower Condo | $2,470,000 | $1,950,000 | $520,000 | 21.05 % |
| Orchid Lane | $803,620 | $610,000 | $193,620 | 24.09 % |
| Palomar Lane | $5,244,510 | $4,500,000 | $744,510 | 14.20 % |
| Park Lane | $2,446,700 | $1,800,000 | $646,700 | 26.43 % |
| Preston Haven Drive | $2,440,600 | $1,875,000 | $565,600 | 23.17 % |
| Purdue Blvd | $1,983,920 | $1,500,000 | $483,920 | 24.39 % |
| Robin Road | $1,425,630 | $1,116,000 | $309,630 | 21.72 % |
| Rockbrook Drive | $5,496,710 | $4,724,550 | $772,160 | 14.05 % |
| Royal Lane | $1,031,370 | $820,000 | $211,370 | 20.49 % |
| San Benito Way | $2,425,210 | $1,482,470 | $942,740 | 38.87 % |
| San Carlos Drive | $4,023,760 | $3,219,000 | $804,760 | 20.00 % |
| Spring Branch Drive | $701,640 | $510,000 | $191,640 | 27.31 % |
| Stone Meadow Drive | $2,669,360 | $2,075,000 | $594,360 | 22.27 % |
| Swiss Avenue | $1,188,410 | $910,000 | $278,410 | 23.43 % |
| Tamerisk Lane | $1,742,340 | $1,369,840 | $372,500 | 21.38 % |
| Tanner Creek Circle | $1,259,250 | $988,000 | $271,250 | 21.54 % |
| Versailles Avenue | $10,965,590 | $9,400,000 | $1,565,590 | 14.28 % |
| Vickery Blvd | $740,140 | $525,000 | $215,140 | 29.07 % |
| Waller Drive | $6,097,180 | $5,150,000 | $947,180 | 15.53 % |
| Washington Court | $1,249,170 | $970,000 | $279,170 | 22.35 % |
| Watauga Road | $6,829,160 | $5,667,920 | $1,161,240 | 17.00 % |
| Westlake Avenue | $6,130,850 | $5,067,980 | $1,062,870 | 17.34 % |
| Wildwood Road | $8,746,550 | $7,092,560 | $1,653,990 | 18.91 % |
| Street | Original Value | Final Value | Reduction | % Percentage |
|---|---|---|---|---|
| Abbey Woods Lane | $1,134,320 | $890,980 | $243,340 | 21.45 % |
| Azure Condo Unit | $1,268,610 | $905,000 | $363,610 | 28.66 % |
| Belmont Avenue | $1,191,810 | $962,000 | $229,810 | 19.28 % |
| Blackburn Drive | $1,224,660 | $900,000 | $324,660 | 26.51 % |
| Bonnard Drive | $571,350 | $422,000 | $149,350 | 26.14 % |
| Capistrano Street | $798,380 | $590,800 | $207,580 | 26.00 % |
| Claridge Condo Unit | $1,038,750 | $760,000 | $278,750 | 26.84 % |
| Country Club Circle | $1,655,580 | $1,340,000 | $315,580 | 19.06 % |
| Devon Drive | $1,377,350 | $1,060,000 | $317,350 | 23.04 % |
| Duchess Trail | $635,460 | $500,780 | $134,680 | 21.19 % |
| E Bethel School Road | $540,340 | $420,000 | $120,340 | 22.27% |
| Forest Lane | $768,720 | $618,720 | $150,000 | 19.51 % |
| Heritage Circle | $774,880 | $572,510 | $202,370 | 26.12 % |
| Ivy Hill Lane | $581,200 | $455,000 | $126,200 | 21.71 % |
| Kahala Drive | $701,190 | $570,000 | $131,190 | 18.71% |
| Kessler Woods Court | $1,889,190 | $1,240,790 | $648,400 | 34.32 % |
| Lakeland Drive | $444,090 | $301,000 | $143,090 | 32.22 % |
| Laneri Avenue | $1,030,740 | $840,000 | $190,740 | 18.51 % |
| Lange Circle | $669,920 | $533,800 | $136,120 | 20.32 % |
| Lavendale Avenue | $1,715,900 | $1,362,610 | $353,290 | 20.59 % |
| Livingston Avenue | $3,593,560 | $2,850,000 | $743,560 | 20.69 % |
| Lobello Drive | $1,443,780 | $1,146,890 | $296,890 | 20.56 % |
| Magnolia Lane | $705,760 | $535,000 | $170,760 | 24.20 % |
| Marbrook Drive | $1,000,320 | $816,620 | $183,700 | 18.36 % |
| Mobley Road | $922,940 | $742,000 | $180,940 | 19.60 % |
| Montgomery Bend | $663,790 | $527,000 | $136,790 | 20.61 % |
| N Clinton Avenue | $571,130 | $436,000 | $135,130 | 23.66 % |
| N Montclair Avenue | $554,590 | $416,000 | $138,590 | 24.99 % |
| N Nursery Road | $1,234,510 | $1,008,000 | $226,510 | 18.35 % |
| Northaven Road | $1,145,400 | $837,810 | $307,590 | 26.85 % |
| Pomona Road | $2,201,070 | $1,741,940 | $459,130 | 20.86 % |
| Redwood Court | $705,040 | $463,520 | $241,520 | 34.26 % |
| Rock Springs Road | $528,850 | $403,480 | $125,370 | 23.71 % |
| Roland Avenue | $1,010,690 | $800,000 | $210,690 | 20.85 % |
| Royal Lane | $637,210 | $522,180 | $115,030 | 18.05 % |
| S Better Drive | $1,330,740 | $1,063,520 | $267,220 | 20.08 % |
| S Shiloh Road | $728,260 | $596,200 | $132,060 | 18.13 % |
| San Leandro Drive | $1,268,430 | $750,000 | $518,430 | 40.87 % |
| Scenic Court | $1,076,950 | $885,170 | $191,780 | 17.81 % |
| Sondra Drive | $1,618,790 | $1,311,380 | $307,410 | 18.99 % |
| Saint Michaels Drive | $1,144,810 | $820,000 | $324,810 | 28.37 % |
| Stonetrail Drive | $1,112,620 | $888,000 | $224,620 | 20.19 % |
| Sugar Mill Road | $705,460 | $565,000 | $140,460 | 19.91 % |
| Superior Lane | $683,060 | $557,000 | $126,060 | 18.46 % |
| Velasco Avenue | $1,140,310 | $873,000 | $267,310 | 23.44 % |
| W Lake Highlands Drive | $2,002,460 | $1,600,000 | $402,460 | 20.10 % |
| Wander Lane | $1,930,750 | $1,531,280 | $399,470 | 20.69 % |
| Washington Court | $1,562,970 | $1,200,000 | $362,970 | 23.22 % |
| West Shore Drive | $557,120 | $417,520 | $139,600 | 25.06 % |
| Wildwood Road | $6,460,590 | $4,723,070 | $1,737,520 | 26.89 % |
Simple Steps to Save You More
How to Protest Property Taxes
in Tarrant County

1. File a Notice of Protest Form (Form 50-132)
You can file Form 50-132 online, by mail or in person. Dallas Central Appraisal District (DCAD) encourages homeowners to file online through uFile. To file online, visit the Dallas Central Appraisal District (DCAD) website and search for your property. You’ll need the pin number that is on your Notice of Appraised Value if you file online.
The deadline to file a Notice of Protest is May 15. Late protests can be filed if the ARB determines you have good cause for missing the deadline, such as a medical emergency. Good cause is entirely up to the ARB.
2. Prepare Evidence
DCAD lists the following items as standards for documentation (evidence) for informal hearings:
- Sale of subject property
- Sales of comparable properties
- Documented evidence of property issues
- Independent fee appraisal
If your reason for protesting is due to an unequal appraisal, you’ll need to provide data showing that your property was appraised at a higher value than similar properties as outlined in Section 41.43 of the Texas Property Tax Code.
Each appraisal district defends its value differently. All residential protests come down to these two elements: Adjustment Calculations and Comparable Selection. Be sure to confirm whether or not the comparables used against you are something you would have considered purchasing at the time you bought your home. DCAD uses smaller sales (price per foot), depreciation adjustments, and size adjustments.
3. Resolve with an Informal Review
The informal hearing is between you and the appraiser. You’ll need to provide copies of your evidence for the hearing.
An informal hearing can be done via phone or email. If you and the appraiser agree to a value, then you won’t need to do an Appraisal Review Board (ARB) hearing.
DCAD also offers a settlement program called the uFile Online Settlement Offer Program for eligible residential properties. This allows homeowners to settle their protest entirely online. Again if the protest remains unresolved, homeowners have the option to do an ARB hearing.
4. Attend an ARB Hearing
If you cannot reach a resolution, you can attend an ARB hearing in person or by phone.
Similar to the informal hearing, you’ll need to submit evidence before your hearing or when the hearing starts. DCAD recommends submitting the evidence five days before the hearing. You can also request the evidence that the appraisal district may introduce at the hearing.
Both parties may not introduce any new evidence during the hearing.
Following the ARB hearing, you’ll receive the ARB’s decision by certified mail.
5. Appeal through District Court or Binding Arbitration
If you are not satisfied with the ARB’s decision, you can file a petition with the district court. You must do so within 60 days of receiving the ARB’s letter. You’ll also have to make partial payment on your property taxes.
There are two alternatives to district court:
- Appeal through binding arbitration (if the appraised or market value is $5 million or less). You must file no later than the 60th day from receiving the ARB letter, and you must pay an arbitration fee.
- Appeal to the State Office of Administrative Hearings. You must file no later than the 30th day of receiving the ARB’s decision, and you also have to pay a $1,500 filing fee.
For the best chance at lowering your property taxes, hire a trusted property tax reduction firm like North Texas Property Tax to represent you through the appeal process.
Get In Touch
Experience More